
Showcase
Hi there, and welcome to my showcase of data science notebooks! As a data scientist, I know firsthand the importance of having a powerful and interactive environment to analyze and visualize data. That's where data science notebooks come in. In this showcase, I've gathered a collection of notebooks that demonstrate how these tools can be used to tackle a wide range of data science challenges. Whether you're interested in data cleaning, data preprocessing, machine learning, or data visualization, there's something here for everyone.
I've put together notebooks that showcase a variety of data science libraries and tools, each designed to tackle a specific problem or explore a particular dataset. So, whether you're a seasoned data scientist or just starting in this field, I invite you to join me on this journey through the exciting world of data science notebooks. Let's dive in and see what insights we can uncover!
Prediction of Gasoline Prices using a LSTM network
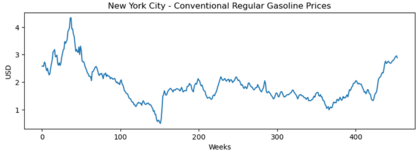
In this notebook a model is implement to predict gasoline prices using a LSTM network (Long Short-Term Memory). LSTM networks are a type of recurrent neural network that can help in predicting gasoline prices based on time series data. LSTM networks are well-suited for handling time-series data because they can capture long-term dependencies and trends in the data.
- Programming language: Python (Tensorflow, matplotlib)
- Dataset: U.S. Energy Information Administration - Gasoline prices from Jun. 13, 2014 to Feb. 17, 2023
- Category: Sequential Regression
- Notebook: click here
K-nearest neighbors classification
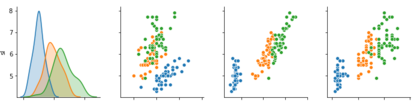
It shows how to implement the k-nearest neighbors algorithm for classification. To classify an observation, this algorithm looks for closer examples using a distance function.
- Programming language: Python
- Dataset: Iris
- Category: Classification
- Notebook: click here
Multilayer Perceptron
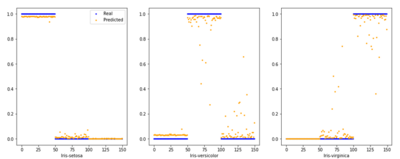
A model is deduced and implemented for the multilayer perceptron (MLP), a feedforward neural network. In the first section, MLP's structure is shown, including the algorithm to transform the input X to the output y^, i.e. the predicted values. In the second section, considerations to optimize MLP's parameters are defined. The backpropagation algorithm indicates how to adjust values for coefficients in each network connection. Finally, a gradient descent algorithm is drawn to integrate forward and backpropagation operations.
- Programming language: Python
- Dataset: Iris
- Category: Classification
- Notebook: click here